Saturday, October 28, 2017

What Are You Paying For And what Are you Getting In Return?


Congratulations to Mr. Pinn (above), who according to a recent Globe and Mail article on Robo-Advisors (by Clare O'Hara) discovered "that he was paying more than $20,000 a year in fees" (on a portfolio of $500,000) and "decided to fire his investment advisor of 18 years". The article goes on to suggest that he has now gone from paying fees of about 4.0% to fees closer to 0.4%.

Everybody needs to take a very hard look at what it costs you to invest and what it is that you get for the fees that you pay.

If "Robo" is the way you want to go, have at it. But it is important to remember that you will get what you pay for.

Don't expect to be high on the priority list from a client service perspective, because you are not paying for it (see my July 20 blog: The Robo-Advisor Option).

If you want a truly excellent client experience and a plan (created, monitored and administered by a Certified Financial Planning, CFP professional) that sets out and truly defines your very tailored investment strategy (with direct access to the managers who implement it), also monitored and adjusted as your circumstances change (and they will, because life is very dynamic) you can get it for a bit more (but not much more) than Mr. Pinn is paying for his Robo-experience. You certainly do not need to be paying 4% or even 1.5% to a financial / investment advisor who might stick you into a bunch of mutual funds (or even ETF's, as I wrote about in my most recent blog, last Wednesday).

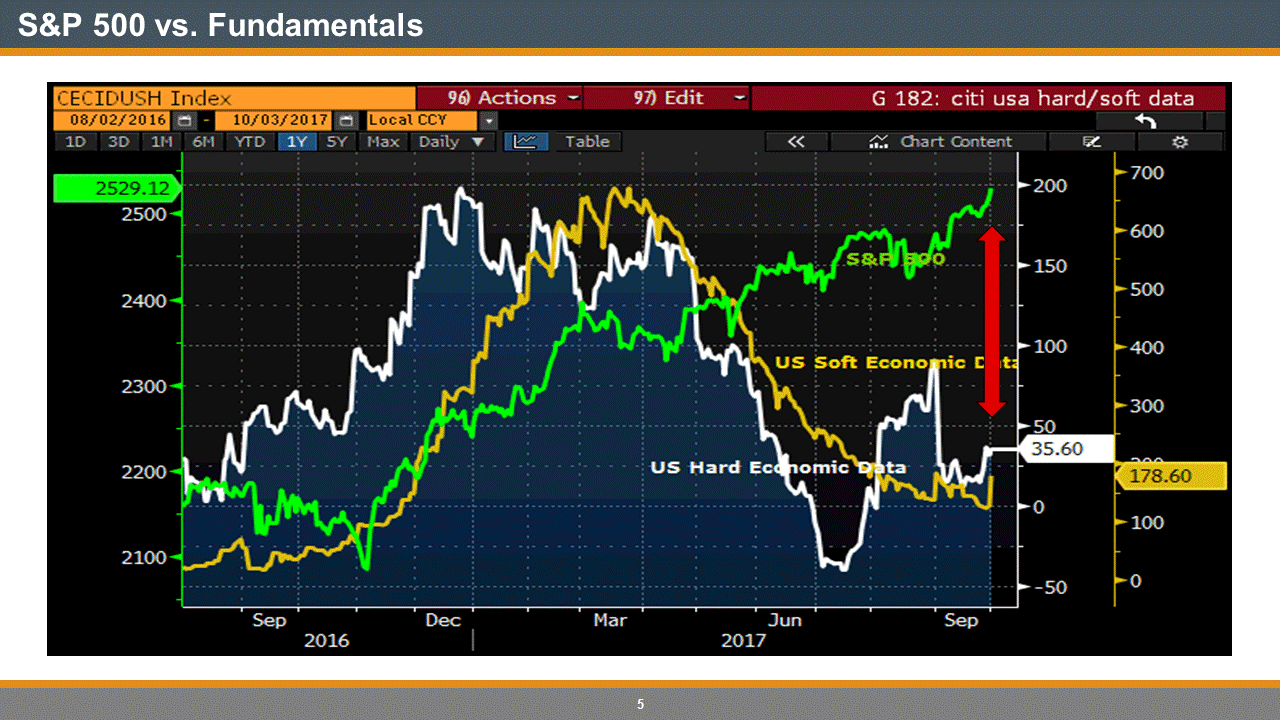
After the volatility of early 2016, stock markets have been pretty good to investors (and volatility has fallen to new lows), but balanced portfolios have been broadsided by both bond market performance and the C$ strength, especially if you have global diversity (which you should have) and exposure to foreign currencies by virtue of that diversity.

Stick-handling that risk requires both experience and expertise. You probably (if you choose Mr. Pinn's path forward) want to ensure that your Robo portfolio managers have the required capability to handle that risk because as we know from history, volatility can jump when you least expect it and unprepared portfolio managers can get blindsided (and so can your portfolio).

I certainly do not want to take anything away from Mr. Pinn's wise decision to research his costs and make the tough decision to end the 18 year relationship with his over-priced advisor. I wish that every bank and large investment dealer client would be so brave.

However, the next step, choosing the most appropriate investment counsel for yourself and your family is also extremely important.

Make certain that you are getting what you need, relative to what you are paying for.

There are lots of alternate choices and portfolio management companies like High Rock, who fly beneath all the advertising hype out there, that are worth looking into.


Wednesday, October 25, 2017

ETF MER's: Have You Checked?


You may have to click on the above to enlarge it, but in the lower right hand corner, you will see the Management Expense Ratio (MER) for the iShares S&P/TSX Canadian Preferred Share Index ETF (CPD) or just click on the link to get a full preview. The point is, there is a cost, above and beyond what your Advisor's Fee is, that is not listed on your monthly statement (although there is a debate as to whether or not it should be, for complete transparency). In this case the MER is 0.51%. iShares (Blackrock) charges this for the Management of the ETF. 

In the fine print: "MER: As reported in the fund's most recent Annual Management Report of Fund Performance. MER includes all management fees and GST/HST paid by the fund for the period, and includes any fees paid in the fund's holdings of other ETF's".

Your Advisor's Fee is tax deductible. The MER is not. So if you are paying your advisor a 1 to 1.5% fee and you have a portfolio of ETF's, your all in costs could be significantly different.

I just reviewed a prospective client's portfolio, all ETF's, that had a weighted average MER cost of an additional (approximate) .35%.

That is where a portfolio management company, like High Rock can give you an advantage. With our institutional division getting us wholesale prices for a number of the securities that we use in our client models (see Paul's blogs from last week) we rely less on ETF's and as a result are able to whittle ETF MER's (on a weighted average basis) down to somewhere between .05 - .08% (depending on the composition of your portfolio) of a total portfolio.

So we charge a 1% management fee, plus a .15% fee that our custodian levies on us (including trading costs) that are all tax deductible. Include our .08% MER fees and all in it is 1.23% (with 1.15% tax deductible)

That is a much better deal than paying 1% to an advisor, plus .35% MER costs. All in at 1.35% (and only 1% tax deductible).

Our 1% management fee gets you a Wealth Forecast (by a CFP professional), monitored and reviewed every 6 months at a minimum, portfolio management from managers who have been in the business since the 1980's (who have seen the market crashes of 1987, 1997, 2001 and 2007) and have the experience to handle it when it happens next and understand the risks involved, as well as the fiduciary responsibility that you only get with discretionary portfolio management.

What are you paying for?

Something to consider.


Tuesday, October 24, 2017

"Hook and Go" Pattern Of Economy Faking Out Bank Of Canada?


One of the hardest football passing plays to defend is the hook or curl pattern (believe me, I played, as a defensive back, so I have plenty of experience with this). We would always be on our guard for this particular play, it was a pretty easy 8 to 10 yards for the opposing offence. However, knowing our coverage was tight, the offence always had the option of  the "fake" hook and subsequent fast break toward the end zone. That left us pretty vulnerable: many a defensive back has been left in a standing still situation as the intended receiver sped downfield, wide open, with little to stop him if he caught the ensuing pass. Touchdown!


So think of the Bank of Canada as the ultimate defensive back, protecting the Canadian economy from inflation's drive to the proverbial end zone (I remember inflation at 9% and my first mortgage at 13%). The Bank of Canada thinks it has the play "read", i.e. that it has inflation covered with its recent interest rate increases as the economy speeds along and then supposedly curls back to pick up the easy 10 yard pass. However, if the Bank of Canada gets a little too cute with its coverage (of preempting inflation) and oh, oh! they are left standing still as the economy gets soft and heads south, they will be left looking around, wondering what just happened.

The Canadian economy had a strong first half of the year, but two interest rate increases and a stronger $C have definitely had a negative impact on the consumer (with record amounts of debt), housing and exports.

The yield curve has continued to flatten (short-term interest rates are up and long term rates are up less):


When the above graph (the yield spread between the 2 year Government of Canada bond and the 30 year Government of Canada bond) now at 88 basis points (or 0.88%) approaches 0, a recession will follow. Bond markets lead all financial markets.

So basically the Bank of Canada is two 1/4% rate increases away from a recession.

That is why it is very unlikely (with inflation remaining well below their 2% target) that there will be any further interest  rate increases. Otherwise, they will be getting "too cute" with the economy and leaving themselves very vulnerable to getting beat for long yardage. 

Tomorrow morning prior to the bank of Canada's Monetary Policy Report and interest rate announcement, my business partner and the founder of High Rock, Paul Tepsich will be the guest host on Paul Bagnell's The Street on BNN from 6am to 8am EDT.


Monday, October 16, 2017

What Financial Success Looks Like


I started looking after these folks more than 10 years ago (I have been helping families manage their wealth and risk since 2000), they came to me with a little under $500,000 in non-registered and registered investments. They were a working couple with 3 kids and RESP's. They had their company benefit life insurance plan, they owned their home (likely valued then at about $350,000 to $400,000) with a reasonable mortgage.

They were not aggressive investors (stewards of what wealth they currently had and wanted to grow), but wanted, as most do, to have a comfortable retirement and some tax efficient method of leaving their kids some of their estate.

We (my team at the time at an independent investment company) set up a Wealth Forecast that included a Whole Life Insurance plan for their estate goals and to offer some diversification away from their investment portfolio strategy. Their retirement goals could ultimately be funded by their investments.

A couple of years into our relationship, along came the financial crisis.

I don't have all the history from this early time in our relationship (because the bank that ultimately bought the investment company we were with, made the assumption that they were the bank's client as opposed to my clients and would not release their history and files to me when I moved our business away from the bank), but I would suggest that they probably saw the value of their investment portfolio slip by about 15% in 2008 and were able to get it back to even by somewhere into early 2010.

When we moved back to an independent investment company in 2012 (from that bank) we started their investing history (from scratch) all over again. We were able to keep their history when we began the High Rock Private Client division in 2015, which looks like what you see here (about a 5 year history):


After fees, the average annual rate of return has been 7.78% over the last 5 years (Return on Investment from the above chart uses the net of fees IRR method).

You can see that there has been some volatility (mid 2014), but for the most part, we have been able to keep the growth (in green) to a relatively smooth up-slope. This is because we manage risk first and foremost.

We have the 4 year return per unit of risk chart for this client (because we don't yet have the 5 year monthly benchmark comparison data yet), but generally, you can see that we have been able to maximize return, relative to the risk that we have taken in this 60% equity, 40% fixed income, globally balanced portfolio: 


Under the Actual HR PC heading in the top table (and circled in green) is the compound annual average 4 year return (absolute return), the risk factor derived from the volatility of the investments (not circled) and the return per unit of risk, which is the compound return divided by the risk factor (also circled in green). By comparison a benchmark of 30% SP/TSX index, 30% ACWI ETF (global equity benchmark) and 40% XBB ETF (Canadian bond index) (circled in red) has both a lower absolute return, a higher risk factor and ultimately a lower return per unit of risk.

So, that is how we manage risk to get that smooth upward sloping level of compounding growth (back to the green in the monthly equity growth graph) for our client in this specific case, but also for our clients in general. 

Most importantly, this is how it relates back to the Wealth Forecast and the growth of their investable assets (yellow, grey and orange) that they will have to fund their retirement goals. 

And of course, the life insurance (blue) will provide tax free transfer of wealth to their beneficiaries.

Sweet success, without taking on extra risk. Good on these folks!

There is an alternative to what the banks and big investment advice firms are offering and we at High Rock are offering low cost, more fiduciarily responsible, full-service wealth and portfolio management.

We would love to help you reach your goals too!


Wednesday, October 11, 2017

World Economic Outlook


The International Monetary fund (IMF) and its team of economists have update their projections for the World Economic Outlook and they are looking slightly improved from their previous outlook in July.


For Advanced Economies, expectations are for an improvement to 2.2% GDP growth (from 2016's 1.7%). Slowing slightly for 2018 to 2.0%.

As I have discussed on many occasions before (and as recently as last week in my blog on Volatility), this growth, which includes 2.2% GDP growth for the US in 2017 and 2.3% in 2018, is in line with the 10 year average. It, however, is hard to see this very average growth as a proponent for well above average equity price to earnings ratios some 20% or more above their 10 year averages.

Clearly all that is potentially positive is more than built in to current equity pricing (including US tax reform).

So, what would be the rationale or incentive for putting cash to work now in global and especially US equity markets? It would appear, with all the good news built in, that there is significantly more downside risk.

Here is what the IMF thinks about the potential downside:

"Risks to the baseline are broadly balanced in the short term but skewed to the downside in the medium term. Short-term growth could increase further, as stronger confidence and favorable market conditions unleash pent-up demand, but setbacks are possible. With high policy uncertainty, missteps -which the baseline assumes will be avoided- or other shocks could materialize, taking a toll on market confidence and asset valuations, and tightening monetary conditions".

If risks are skewed to the downside in the medium term, it suggests to me that buying equities at current prices would require a much larger risk premium than what currently exists.

As we manage risk, first and foremost, in our High Rock models, we need to take this situation into all of our decision making. Specifically because we manage our and our clients money for the long-term (based on the goals identified in our respective Wealth Forecasts). In essence this is our definition of disciplined investing: not chasing returns for short-term growth, but making tactical, short-term decisions that will lead to long-term sustainability in the growth of our portfolios. If that means patiently waiting for opportunities to evolve, then that is what we shall do. We will not force investments into our models for the sake of having investments.

If current prices and valuations do not make sense (i.e. there is not enough risk premium built into pricing), then we will not put our or our clients money at risk. 

We have a fiduciary responsibility to protect our clients (which I have written about on many occasions) and this means that we have to be ultra careful that we are totally prudent with our investing strategy.

We need to look well beyond the current economic, political and investing climate to determine how risk plays into the management of portfolio strategies. So that is what we do.


Monday, October 9, 2017

Conflict Of Interest

"...when the stakes are high and the choices are difficult, people will go out to hire experts to help them. The problem with this argument is that it can be hard to find a true expert who does not have a conflict of interest. It is illogical to think that someone who is not sophisticated enough to choose a good portfolio for her retirement saving will somehow be sophisticated about searching for a financial advisor, mortgage broker or real estate agent. Many people have made money selling magic potions and Ponzi schemes, but few have gotten rich selling the advice, "Don't buy that stuff." "

Richard H. Thaler was (today) awarded the Nobel Prize for Economics.

"The Nobel committee, announcing the award in Stockholm, said that he was a pioneer in applying psychology to economic behavior and in shedding light on how people make economic decisions, some times rejecting rationality." (NY Times)

"Professor Thaler said on Monday that the basic premise of his theories was that, "In order to do good economics you have to keep in mind that people are human."" (NY Times)

One of the most basic of human behavior's in the world of investing is the "recency effect", whereby we tend to project what has been going on in the recent past to our expectations of what we think is likely to go on into the future.

It took a long time for investors, rattled by the financial crisis,  to get back to investing in equity markets, many only recently. But now, after 9 years of positive equity markets...


CNN Money's Fear & Greed Index is pushing its upper limit.

If my/our job (at High Rock) was to keep you fully invested at all times by telling you to stay invested (in order to be paid my commissions), then I would truly have a conflict of interest, especially when I am in the 8% of the Fear and Greed index who is actually fearful.

I guess I will never get rich being a contrarian (according to Professor Thaler), but hopefully, at some point, I/ we will be appreciated for looking out for our and our clients best interests!

Happy Thanksgiving!


Friday, October 6, 2017

Volatility

Back in 2015, one of my/our themes for the year was that central banks loathed volatility because it eroded confidence. As we discussed in our High Rock weekly webinar on Tuesday, all the liquidity that has been added to the global financial system over the last 9 years:


Has very gradually reduced the level of volatility in the S&P 500 (gold line = VIX, volatility index) and other global stock markets:


This liquidity is going to start gradually being withdrawn from the system beginning this month as the US Federal Reserve starts to wind down its bloated balance sheet by not re-investing in the maturing bonds that are currently part of it.

In other words, the white line in the chart above will start to fall. What remains to be seen is what this means for volatility (the gold line). We suspect that it will start to push the gold line higher, i.e. greater levels of volatility.

The liquidity generated from 9 years of extraordinary (easy) monetary policy has found its way into global stock markets, artificially pushing prices to levels that are significantly above what the economic fundamentals have been confirming: relatively modest growth in the vicinity of 2% annually (pink line is the 12 month moving average which smooths out the quarter to quarter changes):


Stocks (on a global basis: All Country World Index, ACWI ETF) have returned a little over 5 1/2% since March of 2008 (Compound Annual Growth Rate):


So  equity markets have been performing at a rate of more than 2X economic growth annually over the last decade.

Clearly, the fundamentals are lagging the stock market: 


And Expected Earnings (12 months forward), relative to stock prices) anticipate some additional 20% improvement (over and above the 10 year average):


So, at some point either the fundamentals will have to catch up to stock prices or stock prices will have to fall to be more in line with the fundamentals.

Hope now resides with the Trump Administration and tax reform and cuts to help drive the fundamentals. You can all make your own decisions on what this might ultimately mean (if it is accomplished or not). We will certainly be monitoring it closely.

With declining financial market liquidity, the stock markets will become more susceptible to economic and / or political shocks. We think that this ultimately defines the current investing market (risk is high) and is limiting investment opportunities at the moment.

And as you all may know, we (at High Rock) are not gamblers, we are managers of risk (first and foremost), so we are prepared to wait for opportunities to evolve (as higher levels of volatility create them) and remain prudently cautious (in the short term). With the knowledge that opportunities will develop (as they always have and always do) to allow us to continue to generate longer-term, strong, risk-adjusted returns:


It is also my duty to tell you that historic returns do not guarantee future returns. However, we, at High Rock, work very hard to get the best risk adjusted returns possible for ourselves and our clients (because we invest in the exact same assets as our clients and back this up with an independent Investment Review Committee quarterly report, which our clients will be receiving shortly with their quarterly summaries).