It’s been a good year.
Despite rising interest rates, market volatility, European debt woes, slow economic growth, the US housing disaster and all the pundits and doom-sayers, 2010 has been a profitable year for Turner Tomenson clients. Our 60-40 model, upon which we base most of our client portfolios (that’s 60% equity-40% fixed income) is at point of writing up by approximately 14% since the beginning of 2010.
Best performer (and who would have guessed?) has been the S&P/TSX SmallCap Index Fund (XCS). Reference: (http://ca.ishares.com/product_info/fund_overview.do?ticker=XCS)
Of this, 56% is held in the Materials and Energy sectors. While it makes up only 3% of our model, it is important that we have exposure to this particular asset class. Because we cannot necessarily pick which asset class will out-perform in any given time period, we want to have exposure to asset classes that have the potential to move higher and add to our model’s ability to achieve growth. This is part of what makes this diverse model so attractive. As you know, our goals are (a) preservation of capital and (b) making it grow.
With the potential for growth in this Small Cap Fund, however, is a greater risk (and potential for volatility) so we want to ensure we keep its weighting light, relative to the rest of the portfolio.
Our (boring) theme continues to be balance and diversity.
Some of the other asset classes that have performed well this year:
The iShares Russell Microcap® Index Fund
The iShares Russell 2000 Index Fund
The iShares Russell Midcap Index Fund
The iShares S&P/TSX Capped REIT Index Fund
The iShares S&P India Nifty 50 Index
SPDR® Gold Trust
Will these out-perform in 2011? Likely not, in fact we’re currently not buying them (and in some cases re-balancing client positions to take profits) because they have become too expensive for our liking. This is exactly what we mean by active management.
It’s also why we preach the discipline of balance and diversity: in all likelihood, one of this year’s underperformers will be next year’s outperformer:
Horizons AlphaPro Gartman ETF (“HAG”)
The iShares MSCI EAFE Index Fund (CAD-Hedged)
The iShares FTSE China 25 Index Fund
As well, we have the Fixed Income stabilizers in the portfolio that focus on interest income and dividends and perform as our model’s anchors when markets become volatile. And we certainly expect more of that in 2011.
Late this year, Equity markets have become stronger as the US Fed has chosen to inflate assets with quantitative easing, but there are perils and uncertainties that can turn the euphoria into fright with one nasty economic or political shock and investors must always guard against complacency.
A large increase in volatility can and may be just around the corner.
Having balance and diversity in a portfolio is the key to limiting the impact of this potential volatility.
We wish you a happy, healthy, prosperous and Balanced New Year.
www.turnertomenson.ca
Thursday, December 30, 2010
Friday, November 19, 2010
It's a boring story: Balance and Diversity (and Yield)
It’s a boring story: Balance and Diversity (and Yield)
If you are looking for an exciting ride from your investments:
STOP READING NOW!
This year saw the Volatility Index (VIX) return to the highest levels since the 2008-09 Financial Crisis amid the calls for a double dip recession (May).
The S&P 500 fell 17% from its April highs in April to its lows at the beginning of July. Certainly not the stomach churning ride of over 50% from the crisis, but certainly enough to drive the already anxious, ready – to – retire folks (who had not already bailed) scurrying into the arms of bonds with 3% returns.
If you could have timed it right and bought from those in a panic, the S&P 500 rallied back to the April levels in the glow of the US Federal Reserve’s renewed stimulus effort (commonly known as QE2, technically referred to as Quantitative Easing) close to 22%.
If you chose to stay invested from the beginning of the year until today you would have secured a meager 5.5% return for all this roller-coastering (and emotional navel-gazing). Better than a 3% (bond yield) perhaps, but also a sleepless night or two.
The 60% (globally diversified) Equity and 40% Fixed Income model portfolio that we follow has produced a total return year to date of near 10.5%. We do not anticipate such good fortune regularly, but we are content with something in the vicinity of 7-8%.
This year's diverse asset classes driving the model?
REIT’s with returns in the vicinity of 20%.
Small Canadian companies with similar returns.
Small US companies.
Indian companies.
Assorted Income Trusts.
High Yield corporate bonds.
Fixed-rate perpetual Preferred Shares.
Next year?
Not sure, but the model will not catch the highs nor will it catch the lows like the S&P 500 (or TSX for that matter). Over time, different asset classes perform differently at different times bringing balance and diversity to a portfolio and smoothing out potential volatility.
It is not exciting, nor should it be.
Want boring investment strategy? We can help.
http://www.turnertomenson.ca/
Wednesday, October 6, 2010
Current Market Conditions
In light of recent market events, we’d like to update you on our perception of current market conditions.
Also remember that our methodology is based on developing a strategy and patiently (and cautiously) building portfolios that will minimize the impact of volatility over the long-term, allowing for more continuous growth.
In some cases this may require a longer period of building while we try to maximize the value of the individual holdings, utilizing short-term volatility in the markets to get the best possible prices. As we have explained before, but wish to emphasize: our strategy is to put purchase orders (for our clients) in below the current market prices so that in the event that market volatility allows a move to lower prices, our orders are executed, providing better value.
We believe that statistically, prices will eventually revert back to the mean and we use the 200 day moving average (for each security) as our guide. Currently, most (if not all) of our securities (that we buy for clients) are trading well above their 200 day moving averages. This is in fact a rare occurrence (anomaly) in the ma rkets.
Bond prices continue to move higher (yields lower) and at the same time equity prices are moving higher (as well as commodity prices, especially gold). Bond prices are moving higher as the demographic (retiring baby boomers) seek to capture more secure yield (income) for their investment strate gy.
gy.
At the same time, central banks in the developed economies that are facing economic stagnation, (Europe, US, Japan) have pledged to buy bonds to continue the monetary stimulus that they believe is necessary to keep the economies from deflating.
While bond yields move lower, this makes dividend yields (from common and preferred shares) more attractive and investors are pulled towards equity markets to take advantage of the better yields. Hence the recent rise in equity prices.
We do not expect this situation to last, however the timing of the next move is uncertain. We had anticipated the economic uncertainty to give way to more volatile markets in September and October, but so far, with the central banks providing comfort for the markets, this has not developed.
And as the famous economist, John Maynard Keynes once espoused: “markets can remain illogical far longer than you or I can remain solvent”!
Again, our methodology for building portfolios is based on patience to get the best possible value for our clients. To discuss your portfolio in detail and the implications for your current situation, we are available at your convenience, so please call Matt Watson or Taryn Ashby (1-800-438-3319) or by email mwatson@wellwest.ca , tashby@wellwest.ca and set up a time to come in or chat with us by phone and we will happily take the time for a review.
Garth Turner
Scott Tomenson
http://www.turnertomenson.ca/
Also remember that our methodology is based on developing a strategy and patiently (and cautiously) building portfolios that will minimize the impact of volatility over the long-term, allowing for more continuous growth.
In some cases this may require a longer period of building while we try to maximize the value of the individual holdings, utilizing short-term volatility in the markets to get the best possible prices. As we have explained before, but wish to emphasize: our strategy is to put purchase orders (for our clients) in below the current market prices so that in the event that market volatility allows a move to lower prices, our orders are executed, providing better value.
We believe that statistically, prices will eventually revert back to the mean and we use the 200 day moving average (for each security) as our guide. Currently, most (if not all) of our securities (that we buy for clients) are trading well above their 200 day moving averages. This is in fact a rare occurrence (anomaly) in the ma
 rkets.
Bond prices continue to move higher (yields lower) and at the same time equity prices are moving higher (as well as commodity prices, especially gold). Bond prices are moving higher as the demographic (retiring baby boomers) seek to capture more secure yield (income) for their investment strate
 gy.
gy.At the same time, central banks in the developed economies that are facing economic stagnation, (Europe, US, Japan) have pledged to buy bonds to continue the monetary stimulus that they believe is necessary to keep the economies from deflating.
While bond yields move lower, this makes dividend yields (from common and preferred shares) more attractive and investors are pulled towards equity markets to take advantage of the better yields. Hence the recent rise in equity prices.
We do not expect this situation to last, however the timing of the next move is uncertain. We had anticipated the economic uncertainty to give way to more volatile markets in September and October, but so far, with the central banks providing comfort for the markets, this has not developed.
And as the famous economist, John Maynard Keynes once espoused: “markets can remain illogical far longer than you or I can remain solvent”!
Again, our methodology for building portfolios is based on patience to get the best possible value for our clients. To discuss your portfolio in detail and the implications for your current situation, we are available at your convenience, so please call Matt Watson or Taryn Ashby (1-800-438-3319) or by email mwatson@wellwest.ca , tashby@wellwest.ca and set up a time to come in or chat with us by phone and we will happily take the time for a review.
Garth Turner
Scott Tomenson
http://www.turnertomenson.ca/
Tuesday, September 28, 2010

Earlier this week, the National Bureau of Economic Research (the official arbiter of recession dates) declared that the recession that began in December 2007 (Chart of the Day declared that the recession was 'underway' back in early January 2008), ended in June 2009 (Back in June 2009, Chart of the Day stated that the recession would ultimately be declared to have ended in June 2009 -- plus or minus one month). For some perspective on the recession just past (a.k.a. the Great Recession), today's chart illustrates the duration of all US recessions since 1900. There are a couple points of interest... Of the 22 recessions that occurred over the past 110 years, the most recent recession is tied for fifth in terms of duration. It is also worth noting that the recession just passed was above average in duration and the longest since the Great Depression.
Quote of the Day"It's a recession when your neighbor loses his job. It's a depression when you lose your own." - Harry S. Truman
Monday, August 2, 2010
Deflation and your portfolio
"Some of the world’s leading investors are becoming more worried about deflation and are re-shaping their portfolios to prepare for a possible period of falling prices. Bond-fund heavyweight Bill Gross, investment manager Jeremy Grantham and hedge fund managers David Tepper and Alan Fournier are among the best known investors who are bracing for deflation, a development that could cripple global economies and world stock markets. The investors cite weak economic figures and a mounting consensus that global policy makers are reluctant, or unable, to take further steps to boost economic growth as reasons for their market positions."
"...preliminary signs of deflation are spurring Mr Gross and the others to take on huge positions of interest-bearing investments such as bonds and dividend-paying stocks..."
Gregory Zuckerman, From: The Wall Street Journal, August 02, 2010 11:30AM
Uncertainty is the rule at the moment and uncertainty tends to drive investors to safer investments. However as the pundits do, so do the investing public and emotion tends to drive investor psychology.
Most of the recent negativity entered the market in late April when volatility (created by the uncertainty) spiked and equity markets dropped between 15-20%. In other words, the sentiment was quickly built into the market. The media are usually the last to the party and only after the big hedge funds have positioned themselves accordingly do they start talking in hopes that the general public will get motivated to follow their course and provide instant profitability to their (the hedge funds/portfolio managers) new positions.
We build our portfolios to, as best as possible, immunize our clients from this volatility: diverse, balanced portfolios. We use asset allocation strategy : for example, in a 60% Equity (a large portion of which are dividend paying) and 40% Fixed Income, this model retracted less than 5% during the late April to early July period and while equity markets remain in negative territory on the year, that portfolio has returned approx. +6% on the year (to date).
Late last year we moved our retired, more cash flow oriented clients to more income driven portfolios with 60-70% fixed income (adding preferred shares with approx 6% dividend yield) thinking that over the next couple of years equity markets may move sideways at best.
With our younger, still working, families who do not require income from their portfolios for the next couple of years (at least) we remained 60-40 (Eq/FI). We still want to have a growth component, but we have actually been focusing on Asia and the emerging economies more for future growth.
In Bill Gross' piece, he focuses more on the developed (G8) countries, mostly on the demographic issues of slowing population growth. We see the global economic engine of growth shifting towards emerging economies where there is significant wealth being created and demand for more developed goods and services as well as above average population growth.
The battle among G8 countries now is who can provide these goods services and who will have the cheapest currency with which to be more competitive. Canada and Australia have the resources, so we focus a little more on those economies as well, but trying to maintain an international bias.
I will not ever discount the intellect of the great economic minds as they ponder the economic future, but I do question their timing and covert intentions when they engage the media.
I think we have taken the long-term approach to reduce volatility and taxes as best as is possible : you should ensure that you have TFSA's set up and maxed: $10,000 (each) now and $5,000 (each per year going forward).
While we think equity markets will move sideways (in a range) for the next little while, we also are not going to be able to time the next growth leg accurately so that any change in asset allocation should be considered with long-term implications based on future cash flow needs.
That being the case I am happy to discuss your cash flow needs, the benefits of perpetual preferred shares and any other asset allocation issues whenever you have the time.
www.jstomenson.ca
Saturday, July 17, 2010
On April 29th I asked if you were prepared for Volatility

We are in a new era of heightened volatility caused by the many uncertainties currently permeating the global economy:
1) Fiscal Issues in Europe
2) Moderating economic growth in China and the US.
3) Rising interest rates and a declining housing market in Canada
4) Consumers more interested in saving
5) Record levels of corporate cash, sitting idle.
2) Moderating economic growth in China and the US.
3) Rising interest rates and a declining housing market in Canada
4) Consumers more interested in saving
5) Record levels of corporate cash, sitting idle.
On April 29th I asked you if you were prepared for that volatility. If you were our clients you were.
The ETF SPY (S%P 500) dropped 17.19% from its high on April 26 to its low on July 1st.
Over this same time period our diverse and well-balanced model (60% Equity, 40% Bonds and Preferred shares) fell approximately 7.41%.
In fact, 2010 to date, the SPY is down 4.29%, the XIU (TSX 60) is down 1.92% and our model is up 2.16%.
Keeping volatility low in a portfolio is the key to capturing long term growth. The key to keeping volatility low is to have balance and diversity in a portfolio:
Across asset classes, geographical economic zones, economic sectors and company size.
Across asset classes, geographical economic zones, economic sectors and company size.
Keeping correlations between these different investments as low as possible, so that they do not necessarily move in concert with each other.
In his most recent Global Economic Monthly Review, Neil Soss, well-known economist at Credit Suisse suggests that the era of rare, brief and mild recessions experienced from the early 80’s to the mid 2000’s is over:
“expect …more frequent slowdown and speed-up scares” and “expect the slowdown scares to be scarier.”
In other words volatility is here to stay, so “buckle-up” and immunize your portfolio as best as is possible.
This is where our expertise lies: minimizing the impact of volatility, so that growth can be achievable.
We also look closely at the impact of taxes on a portfolio, maximizing the opportunity to reduce them and add value to the after-tax growth.
Make sure that you are maximizing all the opportunities available to you to get the growth that you need. We can help.
Tuesday, June 1, 2010
BOC Ups Rate To 0.50%,Further Hikes "Weighed Carefully"
( DJ ) 06/01 09:04AM =DJ BOC Ups Rate To 0.50%,Further Hikes "Weighed Carefully"
OTTAWA (Dow Jones)--The Bank of Canada Tuesday became the first G7 monetary
authority to raise interest rates since the credit crisis, but said any
further increases would have to be weighed carefully against domestic and
global economic developments.
The Bank raised its benchmark overnight rate by 25 basis points to 0.50%.
The rate had been at a record low 0.25% since April 2009.
The highly anticipated decision underscores the Bank's dilemma as it weighs
a strong domestic economy against concerns about the impact of the euro-zone
debt crisis on a global economic recovery that it acknowledged to be
"increasingly uneven" across countries.
The Bank said "considerable" monetary stimulus is still in place.
"Given the considerable uncertainty surrounding the outlook, any further
reduction of monetary stimulus would have to be weighed carefully against
domestic and global economic developments," the Bank said in its interest rate
statement.
The widely expected rate hike is the Bank's first since July 2007 and the
first under the watch of Governor Mark Carney who took over the top job in
February 2008. The Bank also re-established normal functioning of the
overnight market, including reverting to a 50 basis point operating band for
the rate.
The Canadian dollar was little changed immediately after the rate decision
was published at 9:00 a.m. EDT. The U.S. dollar was quoted at C$1.0490 from
C$1.0492 just before the release.
The Bank said the euro-zone debt woes are likely to result in higher
borrowing costs and more rapid tightening of fiscal policy in some countries.
The Bank pointed out that it had identified this as a key downside risk in the
April Monetary Policy Report.
"Thus far, the spill-over into Canada from events in Europe has been limited
to a modest fall in commodity prices and some tightening of financial
conditions," the Bank said.
It said global economic recovery is "increasingly uneven" across countries.
In Canada, it said activity is unfolding "largely as expected."
Web site: http://www.bankofcanada.ca
-By Nirmala Menon, Dow Jones Newswires; 613-237-0668;
nirmala.menon@dowjones.com
jstomenson@wellwest.ca
Tuesday, May 25, 2010
Piecing It Together : OCM update
Piecing It Together, May 21
For the most recent commentary from our friends and colleagues at One Capital Management
click on the link below.
http://www.onecapital.com/webcast_08.html
to discuss this or any other Wealth Management Issues
jstomenson@wellwest.ca
http://www.jstomenson.com/
For the most recent commentary from our friends and colleagues at One Capital Management
click on the link below.
http://www.onecapital.com/webcast_08.html
to discuss this or any other Wealth Management Issues
jstomenson@wellwest.ca
http://www.jstomenson.com/
Wednesday, May 12, 2010
An Investor’s Odyssey Is Never a Smooth Ride
An Investor’s Odyssey Is Never a Smooth Ride
May 10, 2010
Last week saw volatility return to equity markets after a long hiatus. The VIX Index, which measures the implied volatility of equities based on options on the S&P500 index, spiked to a level of 42.15 on May 7. While the level was nowhere near as high as that reached following the bankruptcy of Lehman Brothers in September 2008, it serves to remind investors that the global financial crisis that started a year and half ago is not entirely behind us.
In this instance, the small Mediterranean nation of Greece instigated the market sell-off. After months of negotiations between Greece and its fellow European Union members, the country agreed last week to adopt punishing austerity measures in exchange for a $US 143 billion bailout package backed by the EU and International Monetary Fund. While Greece’s fiscal woes have been understood for some time, markets were jolted by the final size of the bailout, the resulting public protests and the potential implications for EU members in similar fiscal situations, namely Portugal, Italy, and Spain. As was the case with Lehman, markets are concerned that Greece is the canary in the coal mine warning greater market declines.
Opposing these sovereign debt issues is continued improvement in economic and equity fundamentals. Statistics Canada reported that 108,700 new jobs were added in Canada in April, bringing the employment rate down by 0.1%. In the U.S., while the unemployment rate inched higher, data pointed to improvement in consumer spending with a 0.6% increase in March – the most in five months. Manufacturing also saw continued expansion with the Institute for Supply Management’s index rising to 60.4, indicating the ninth straight month of expansion. At nearly the end of earnings season, we also received news that 77% of S&P500 companies have reported earnings better than analysts’ estimates. And at the time of writing, the EU unveiled a $960 billion rescue fund for to backstop EU governments in financial distress.
In April, we wrote that this was a time of contradiction – with good and bad news fighting for investors’ attention. The events in Europe, while unsettling, do not shake us from our conviction that investors are best served by holding high quality stocks and not attempting to time the market. The pain of market timing can most certainly be felt by those that sold into the weekend only to see markets rebound on Monday. Rather, at Wellington West Asset Management Inc., we have structured our Canadian and US equity portfolios to benefit from improving equity markets, but with reduced downside risk should the bull market of 2009/10 take a pause.
Sources: Bloomberg, Wall Street Journal, Financial Times
Wellington West Asset Management Inc.
www.wellingtonwest.com
Graeme Hay, CMA
Investment AnalystWellington West Asset Management Inc.
www.jstomenson.ca
Thursday, April 29, 2010
Is your portfolio ready for an increase in volatility?

Is your portfolio ready for an increase in volatility?
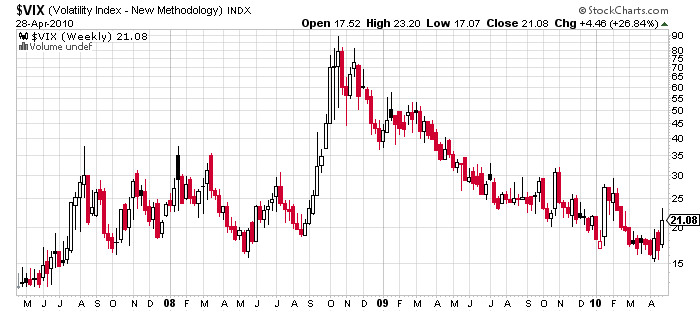
When the market hit maximum uncertainty in late 2008, volatility spiked to extreme levels. Since then volatility has declined substantially.
When the market hit maximum uncertainty in late 2008, volatility spiked to extreme levels. Since then volatility has declined substantially.
While there has been some sustained gradual global economic recovery, lead by emerging markets (and this is expected to continue), there are growing uncertainties being caused by Europe’s sovereign debt crisis that could play havoc with investors confidence, thus turning the trend in volatility.
In my experience, an increase in volatility tends to lead to a change in trend. We are almost 14 months into the up-trend that started in early March 2009.
If I have learned anything in my 28 years as an investment professional, it is that complacency is everyone’s enemy. We must always be on guard for the unexpected. While there is never absolute certainty that a trend will change, we must always be on guard for it. Most times, like in late 2008, you won’t know what hit you until it has already run you over!
So I preach diversity and balance as a portfolio protector from volatility.
Diversity across asset classes: bonds and preferred shares for yield, equities for growth. When equities don’t provide growth, bond income and preferred dividends will.
Diversity across global economies: emerging economies are leading the recovery, but US equities have been leading the stock market.
Diversity across company size: US small and micro cap companies are leading the US equity markets.
When you get “outperformance” by one asset class, then you rebalance to redistribute portfolio profitability to the underperforming sectors that will not remain underperforming forever.
Volatility will return, I can’t say exactly when, but when it does, be prepared!
I can help:
www.jstomenson.com
Monday, April 12, 2010
Envision your Future 2 , Thurs. April 15, 1pm.
Webcast envision Your Future, Thursday April 15th, 1pm.
“a glimpse into your future, a planning tool, more certainty, comfort and peace of mind."
1. Please join my meeting.https://www1.gotomeeting.com/join/586104608
2. Join the conference call:
Local Dial-in number: 416-343-2285
Toll-free Dial-in number: 1 877-969-8433
Conference ID: 9764038
“a glimpse into your future, a planning tool, more certainty, comfort and peace of mind."
1. Please join my meeting.https://www1.gotomeeting.com/join/586104608
2. Join the conference call:
Local Dial-in number: 416-343-2285
Toll-free Dial-in number: 1 877-969-8433
Conference ID: 9764038
Thursday, March 11, 2010
Envision Your Future
Webinar:
http://www.wellwest.ca/ww_dl/Meet_Now.wmv
“a glimpse into your future, a planning tool, more certainty, comfort and peace of mind."
www.jstomenson.ca
http://www.wellwest.ca/ww_dl/Meet_Now.wmv
“a glimpse into your future, a planning tool, more certainty, comfort and peace of mind."
www.jstomenson.ca
Wednesday, February 24, 2010
What Frustrates you most about banking?
What frustrates you most about banking?
If you have a mortgage and a chequing or savings account (with the same institution), what is the spread they are they are taking on you?
What is your mortgage cost (interest rate): 4% perhaps?
What are they paying you for the money that you are lending them back in your chequing account? 0% (they get this money from you for free).
In your savings account? 0 .5%.
So the spread they are taking on you in this scenario is 3.5% to 4%.
If you have a mortgage of $250,000 and savings of 40,000 (savings account), your net borrowing should be $210,000 if you were able to apply your savings to your mortgage. You would be paying approximately $1400 less per year in interest costs (that are not tax deductible). That adds up over time.
So why do the banks not let you do this?
They don’t want to lose the free $1400.
Then there are the fees and don’t forget the gouging spread on foreign exchange.
I can help solve the first issue and generate very good ideas for flexibility in your cash flow, especially if you have a variable income stream.
Of course: cash flow is the engine that drives a financial plan.
If you want to explore any of these options, let me know, we build Wealth Forecasts to show you how to maximize efficiencies in your financial plan and mitigate risk in your investment portfolio.
jstomenson@wellwest.ca
www.jstomenson.ca
http://www.financialpost.com/magazine/story.html?id=2514256
Monday, February 1, 2010
Do more of that which is working
“Do more of that which is working and less of that which is not”!
That is one of Dennis Gartman’s 20 rules of trading. Dennis Gartman, if you do not already know, is a widely read and admired market commentator who writes a daily letter to which I subscribe and it is the first reading on my agenda every morning. Ever insightful and informational on a variety of topics: markets, currencies, commodities, economics and politics.
Every year on the Friday after US Thanksgiving he publishes his 20 rules of trading.
“Do more of that which is working and less of that which is not”!
So what is working?
1) Clients both old and new are slowly coming around to the idea of seeing their “Wealth Forecast”.
a. Generally speaking, this is a spreadsheet that we create that shows clients their income streams now and those that are forecasted for their future vs. their desired or expected lifestyle needs (cost of living) and then analyzes what the approximate impact will be on their assets.
b. We make a number of adjustable assumptions on things like return (after fees and taxes), inflation, tax rates and we create a “working model” from which we can project 10, 20, 30 or more years into the future.
c. We have the ability to create a number of different models that represent scenarios from which we can select the most advantageous options.
d. From this we have a full understanding of the clients risk profile.
e. We make the appropriate asset allocation strategy and implement it.
f. What we have is our “benchmark” from which we can gage the client’s progress.
g. If (as we fully expect there will be) there are any changes that need to be addressed we can quickly re-asses strategy by making adjustments and visualizing their impact on our model, followed-up with an adjustment of strategy.
2) While we believe that over the longer term, 5 to 10 years, equity markets will resume their upward trajectory, we also know that:
a. Clients have cash needs (from their assets)
b. Depending on specific needs, we believe that a diversified, balanced portfolio will allow easier access to client assets for these purposes.
c. Where are we finding balance and low volatility (i.e.while equity markets are down, what is up) ?
i. One Capital Management, managed portfolios
ii. Waterfront Nxt Income and Growth
iii. Norrep Yield Fund
Visit our website at www.jstomenson.ca
Envision your future
Subscribe to:
Posts (Atom)
