Monday, January 30, 2017

Buy American! (But It Will Cost You More!)


It is easy work to cut a trade deficit: export more goods and services and import less. If you want to export more, you need to be more competitive in off-shore markets. One way to get more competitive is to lower prices. The cost of your home currency relative to the currencies of the countries into which you are to export is crucial. So is the cost of production (including labour). 

For the US, "Buy American, Hire American" policies will push costs up and likely push prices up making exports less competitive, unless the $US is falling enough to offset this.  Trade tariff's (imposed by the importing country) can also add to increased costs (so one would think that it would be in the best interest of the exporting country to negotiate the lowest possible cost barrier (hence "free"-trade).

As the US is a net importer of goods and services (more imports than exports), one would think that growing exports (economically positive) would be more beneficial than shrinking  imports (economically negative) with tariffs to get better balance.

As for S&P 500 revenues (upon which these 500 US companies are able to grow their earnings), some 30% plus come from exports.


If a trade war (increased trade tariffs on US exports, by importing countries) follows the US strategy of protectionism (higher tariffs on imports), S&P 500 revenues will decline, followed by earnings.

Some may argue that more working Americans will spend more on US ("Buy American") goods and services to offset this. I will argue that higher prices will push workers to demand more income (higher labour costs, from a shrinking labour pool) and that this will bring higher inflation and higher borrowing costs (more cost increases).

Nonetheless, if your sales revenues are falling and your production costs are rising, it will take a substantial reduction in taxes (proposed) to just offset this.


Assume revenue goes down 5% and costs go up 5% and taxes are cut by 20%: anyway you look at it, it is negative for the bottom line which can't be good for the economy. 

Without increased tax revenue (from a stronger economy) government debt and deficits (higher infrastructure spending) will build and the outcome will not be good.

Feedback...

If you would like to receive this blog directly into your inbox...

Friday, January 27, 2017

So... Do you Have A Plan?


I so love doing Wealth Forecasts with clients (as we did yesterday for one of our families).

They come in to our meeting with such dour expectations and worries and leave an hour or so later with a very satisfied and much happier outlook.

So why don't families make more time to get a plan? 

It is oh so very important.

First and foremost we (High Rock Capital Management) are a portfolio management company (we are not financial or investment advisor's who collect commissions, see Rob Carrick in the Globe Investor section: "Bad Advisor Behaviour...") and we cannot begin to offer a holistic investment strategy unless we fully understand the goals and objectives, risk tolerance and time horizon issues of our clients.

The simple questionnaire on a typical (IIROC approved for Advisor's) application falls far short (in our humble opinion) of what we consider the appropriate amount of information necessary to build an investment strategy.

So we create a plan, or Wealth Forecast (administered by a licensed Certified Financial Planning professional, CFP) in order to get a full understanding of the family or individual that we are working with.

The more important part of this Wealth Forecast is the on-going monitoring of it over time. Every 6 months we sit back down to make sure that we are progressing toward our clients goals: where are we now? vs. where did we expect to be? and what, if any, changes need to be made.

Our client yesterday was a good $50,000 ahead of where their plan had forecasted they would be just 6 months ago. That is progress. I think we earned our fee.

Further and perhaps equally as important is that it allows our clients to create various "what if" scenario's: "If we increase our retirement travel spending, how does this impact our long- term net worth projection?" Or "how do home renovations impact our long-term net worth projection?", etc.

The great thing is, that once we have the base plan, we can easily make adjustments to determine the best possible outcomes for lifestyle goals and for legacy goals (I want to have $$ to leave to my children, grandchildren or favourite charity) or any changes to those goals.

Then, we can adopt a portfolio strategy and asset allocation that truly reflects each of these clients' particular situations and / or circumstances.

There is no room here for a "one strategy fits all" portfolio composition.

If your advisor just wants to stick you into a bunch of mutual funds or ETF's without giving you the rationale for how this is the best fit for your specific needs, just ask how she/he knows what is right for you. If you don't get a suitable answer, I would be happy to help.

If you want to see how your net worth projection looks out to the end of your time on this planet, we are always happy to help.

Feedback...

If you would like to receive this blog directly to your inbox...

Thursday, January 26, 2017

Dow 20,000! Wahoo!!
Now What?


Like him or not, believe in him or not this is Trump Euphoria and for now, emotions are running high and if this draws more retail investing, it could go even higher because retail investors (according to the mutual fund and ETF net inflow/outflow data) have not been participating, yet. 

At the moment it is debt and deficits "be damned", we'll worry about how to pay for all of this (tax reduction, infrastructure spending) down the road.

Problem is, equity markets have built in all the good things (and perhaps more) that they can imagine: Earnings growth for 2017 is expected to be about 11.5% and still the prices relative to earnings on a forward looking basis are at post recession highs (17 times) and well above their 10 year averages (14.4 times). Other valuation metrics that we monitor suggest a similar situation. So stocks are expensive (and they may get more expensive).

So what do you do? 

Get more tactical: if you hold equity assets, you may want to gradually reduce your exposure into this euphoria in stock markets and look for less correlated assets that represent value.
When the euphoria dies down and equity market participants start to look for the rationale (value) for their ownership, it could be a fairly rude awakening (and sleepless nights may ensue).

Nothing goes up forever.

That's what we do at High Rock, we look for value and don't feel the absolute need to buy into over-priced equity markets (which does not mean that we don't own stocks by the way). And as I showed in  yesterday's blog, it is not necessary to be heavily participating in the overly emotional stock market in order to get solid risk-adjusted and / or total returns over longer time periods.

When we do wealth forecasts for our clients, they can span the time frame of 30-50 years, so one year returns are a very small drop in the relative long-term bucket. Restful nights come from seeing your goals get closer and closer to reality as time moves forward. Do you have a plan?


Feedback...

If you would like to receive this blog directly to your inbox...

Wednesday, January 25, 2017

A Tale Of Two Portfolios

Interestingly, after we finished our Tuesday client webinar (http://highrockcapital.ca/current-edition-of-the-weekly-webinar.html) I was sent a portfolio summary from a non-client, who will soon become a new client. I was blown away by the volatility I saw in this "buy and hold" mostly ETF, 60% equity / 40% fixed income strategy over the last 2 1/2 years: 


The 1 year return is excellent and slightly better than the benchmark blended 60% ACWI (All Country World Index)/ 40% XBB (Canadian Bond Index) portfolio (after fees and costs) of 11.16%. However, as we suggested on our webinar, the buy and hold strategy, dug a big hole in this portfolio in the early part of 2016 and these poor folks had to sit and "ride it out" with a significant number of sleepless nights. The longer term return (2 1/2 years) has been a very mediocre 1.43%. 


Comparing a more tactical and flexible 50% global equity model, 40% fixed income and 10% tactical model strategy of a High Rock client over this same period of time:


Certainly the 1 year return is not as substantial as the "buy and hold" strategy, but without all the volatility the 2 1/2 year return is a significantly better annualized average of 6.33%. 

Why does the High Rock client sleep better?

Return per unit of risk:


The High Rock client portfolio has a lower risk measurement and a better return, so in an "apples to apples" comparison, the High Rock client portfolio has a much better return per unit of risk (risk-adjusted returns).

So folks, it is not about the 1 year return as much as it is a long-term strategy to try to reduce risk, maximize return and limit volatility to smooth out portfolio growth and limit sleepless nights.

And as you all well know, past performance is no guarantee of future performance, but as a portfolio management company with expertise in wealth management, portfolio construction and deep levels of research, we work darn hard to get our clients and ourselves the best possible risk-adjusted returns.

Feedback...

If you would like to receive this blog directly to your inbox...

Monday, January 23, 2017

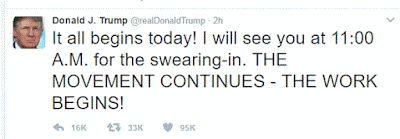
 New President Trump:
"We Will Follow Two Simple Rules: Buy American And Hire American"


What does that mean for US companies? (and we care because the All Country World Index, the global equity index upon which we benchmark our equity performance, has 53% US companies in its composition).

It means increased costs (for labour and materials) and likely increased prices passed on for the sales of goods and services to cover those costs. The costs of US labour were the key to driving offshore out-sourcing to considerably cheaper labour markets in years past.

In short, the economic laws of comparative and competitive advantage, which have allowed US companies to grow profitability in years past, may be regulated against. 

Higher costs and wages and higher prices have been the basis of what has become referred to as "reflation".

That is all well and good, as long as economic growth is driving it. Otherwise, it is called "stagflation".

From the text of President Trump's inaugural address:

"Every decision on trade, on taxes, on immigration, on foreign affairs, will be made to benefit American workers and American families. We must protect our borders from the ravages of other countries making our products, stealing our companies, and destroying our jobs. Protection will lead to great prosperity and strength."


Protection (trade policy) does not lead to great prosperity (as has been proven throughout history) and growth, so it remains to be seen how great US economic growth will follow.

We are standing by, waiting on detail, although it is hoped for and expected that tax reform, tax reduction and deregulation (for those who comply) should help to offset additional costs to corporations and that infrastructure spending will also add to the economic growth mix:

"We will build new roads, and highways, and bridges, and airports, and tunnels, and railways all across our wonderful nation."

What is not clear however, is exactly what this will cost (reduced tax revenues and increased infrastructure spending) and who will pay for it all. Initially, it is anticipated that the US government will bear the brunt of this with sizable increases in deficit spending (funded by the issuance of more US government bonds). 

What is hoped for is that increased economic growth will in turn eventually draw more tax revenues to help pay down the increases in debt levels, however it is hard to see that end result without any specific detail (especially if trade protectionist issues become severe). Deregulation in the early 2000's under then President Bush ended in a financial market crisis. 

Another question comes to mind: how do you deregulate while at the same time try to regulate ("buy American and hire American")?

Cue in more uncertainty.

Feedback...

If you would like to receive this blog directly to your inbox...


Friday, January 20, 2017

Canadian CPI Higher, But Still Well Below Target


Total CPI was up 1.5% in December, Up from November's number of 1.2%. Gas prices lead the way with a 5.5% increase. Food prices were down by 1.3%.

The Bank of Canada's series of core inflation data were basically unchanged. Inflation in Canada remains very subdued, don't expect any change in BOC interest rate policy any time soon. You can keep your variable rate mortgages variable.

Meanwhile, despite signs of rising inflation in the Euro zone (but still well below the target), the European Central Bank left its extraordinarily easy monetary policy unchanged (as was expected).


US Federal Reserve Chairwoman Janet Yellen spoke at Stanford University saying: "Economic growth more broadly seems unlikely to pick up markedly in the near term given the ongoing restraint from weak foreign demand". Rising US interest rates (bond yields and longer term rates), a strong $US and an aging population all factors for caution.

Now, it is wait and see what new fiscal and trade policies emanate from the White House:


Wednesday, January 18, 2017

US Inflation Inches Up
Bank Of Canada Builds In 0.5% Additional US Growth


According to the US Bureau Of Labor Statistics, Total CPI was higher by 2.1%. Energy was the big gainer at 5.4%, followed by Medical Care and Shelter. Restaurants also added to the increase. The US Fed targets a level of 2% for the core PCE price index which will be announced on Jan. 27.

Closer to home, the Bank Of Canada left rates unchanged and issued its Monetary Policy Report and while stressing "undiminished" economic uncertainty ahead, they are building an additional 1/2% of US GDP growth into their projection allowing for some measure of increased US fiscal stimulus.

http://www.bankofcanada.ca/2017/01/opening-statement-180117/

However, the BOC feels that the impact on Canada will be small.

Furthermore, they acknowledge that higher bond yields in Canada on the back of higher US bond yields (see our themes for 2017) are generally "at odds with Canada's macroeconomic situation". 

As well, the stronger C$ is creating economic headwinds for Canada's export economy.

Finally, as I suggested in my Jan 9 blog, inflation remains well below the BOC targets, whereby they have no intention of raising rates in the near term. So all you floating/variable rate mortgage borrowers can breath easy, at least for a while. Canada's December inflation data is due on Friday, so stay tuned for an update.

Feedback...
Scott

If you would like to receive this blog directly to your inbox...
bianca@highrockcapital.ca

Tuesday, January 17, 2017

A New World Order May Be Emerging
But Who Will Be In Control?


Theresa May wants a "clean" break and a new comprehensive, bold and ambitious free trade agreement for the UK.

China's Xi Jinping says that "Countries should view their own interest in the broader context and refrain from pursuing their own interests at the expense of others.

Donald Trump appears to want to cozy up to Vladimir Putin (maybe it is a case of "keep your friends close and your enemies closer"?).

Meanwhile, Europe (Germany being the main benefactor of the EU) is struggling to stay together.

Canada and Mexico are watching and waiting.

There could be tectonic shifts about to happen, so it is more important than ever to have a flexible portfolio strategy, especially when equity markets (lead by the S&P 500) appear to be at full value.

We will talk about this, and other financial market and global economic developments and how this impacts our client's wealth management strategies today on our weekly webinar.
Please feel free to tune in to the recorded version which we will publish on our website at or about 5pm today:

Sunday, January 15, 2017

And Back To The Fundamentals...

S&P 500 earnings for 2017 are expected to grow by 11.4%. which will be significantly better than earnings growth for 2016, which will come in basically flat (if Q4 earnings come in as expected).

The S&P 500 for 2016 returned (total return including dividends on a daily basis, source Bloomberg) 11.95%. In 2015, by contrast, the S&P 500 had a total return of 1.37% and in that year earnings growth was slightly negative.

Needless to say, investors have built a great deal of future earnings into the current pricing of the S&P 500 companies. In fact, the 12 month forward looking earnings per share (EPS) is at close to the highs at 17 times (relative to the 10 year average of 10.4 times).


Investors are rather positive then, about the outlook. 

However, as is the case usually about 2 times per year, the CNN Money Fear and Greed Index has peaked and is slipping out of the higher levels of "greed". Probably not a good sign for those who have been paying too much for US equities. It will be nice to have some extra cash on hand to pick up cheaper assets when the index heads into "fear" territory, which it does also usually a couple of times per year.


It's good to be tactical (our key theme for 2017)!

Feedback...

If you would like to receive this blog directly to your inbox...


Thursday, January 12, 2017

Trump Headlines And Tweets Aside, 
Back To The Economic Fundamentals

While we wait for more specifics on future US economic policy (currently long on promise, short on detail) we move our focus back to the global economy and central bank policy:

The Bank of Canada (BOC) announced the results of its winter Business Outlook Survey earlier this week which suggests improving over-all business prospects, reflecting a "building domestic demand, a supportive export outlook and an expected recovery in energy-related activity". More importantly, perhaps, inflation expectations are "ticking up".


This will certainly get the Bank of Canada's attention and although total CPI and some of the other measures are still below target, increases in inflation will be their primary focus. The BOC will announce their next policy decision next Wednesday (Jan. 18) and while we do not expect any changes to interest rates, recent gains in employment are encouraging (although the stronger C$ is going to be a concern). Canadian CPI data is due to be announced next Friday.

The European Central Bank will announce their latest interest rate and monetary policy decisions on the same day (a little earlier) and while inflation and economic activity have been picking up, there will likely be no change in interest rates, but financial markets will be watching for any changes in their bond buying program.

The US Federal Reserve will announce its latest decision on Feb. 1. Consumer sentiment is improving and there is hope in the business community (which may lead to a better investment climate) and while inflation pressures (in commodity prices and also wage data) are growing and unemployment is close to full capacity, it is expected that they will not yet be raising interest rates.

The UK continues to be preoccupied with Brexit, the pound has been flirting with its post-Brexit lows:


And while this has actually assisted the British economy recently, consumers are not confident (because of Brexit) and will be a drag on the economy going forward. The Bank of England will announce its next interest rate decision on February 2.

Feedback...

If you would like to receive this blog directly to your inbox...

Tuesday, January 10, 2017

Risk and Return in 2016

Last week I wrote about why a more tactical approach was necessary for portfolio performance that could continue to out-perform the comparative benchmarks. Otherwise, you could just buy the benchmarks (via a couple of ETF's) and avoid paying advisory fees.

The All Country World Index ETF (ACWI) had a total return (source: Bloomberg TRA, daily basis) of 8.40% over the course of 2016 and a 2 year total return of -0.95% (remember 2015 was a difficult year for equity markets). ACWI is comprised of about 53% of US equities.

The Canadian Bond Index ETF (XBB) had a total return (source: Bloomberg TRA, daily basis) of 1.29% after a very tough 4th quarter with a total return of - 3.49%. The 2 year total return was 2.27%.

A combination 60% equity (ACWI), 40% fixed income (XBB) portfolio returned 5.78% over 2016 (after a -0.77% for the 4th quarter). The 2 year combined performance was -0.21%. 

For comparison purposes, using an actual  High Rock client portfolio who joined in January of 2016: 


This particular portfolio is comprised of a combination of 50% of our Global Equity model, 40% of our Fixed Income model and 10% of our Tactical (mostly small cap Canadian companies) model. Clearly the 7.79% total return (after our 1.15% fee) is nicely ahead of the benchmark combination, in large part due to the tactical model providing over-weight exposure to Canadian companies through the year (ACWI weighting for Canadian companies is 3%). However, that was not all. Despite a significant drop in bond markets through the final quarter of 2016, a tactical approach allowed us to minimize the impact by making an adjustment to the duration of our portfolio and adding a portion of floating rate assets (post Trump election) that improved by approximately 5% in December alone.

More importantly, we did not have to increase our risk exposure to pricey equities to get there. In fact our return per unit of risk was even less than the benchmark combination (including an average 20% cash equivalent weighting that is /was slated for future opportunity as well as risk mitigation):


The actual High Rock client portfolio (circled), after adding back 1.15% in fees for comparison purposes, had higher returns and less risk (risk increases to the right along the horizontal index) than the 60/40 (combination of ACWI and XBB). This is based on 1 year monthly total return analysis (TRA, source Bloomberg). 

As always, historical returns are in no way a guarantee of future returns.

We will be discussing this and our High Rock performance for 2016 in greater detail as well as our outlook for 2017 in our weekly client webinar today. We will post the recorded version on our website at or about 5pm today: http://highrockcapital.ca/current-edition-of-the-weekly-webinar.html


Monday, January 9, 2017

Your Mortgage: Variable or Fixed?

There is no blanket, one strategy fits all answer to this question because it clearly depends on a large number of personal circumstances. 

Certainly from a macro economic perspective, if interest rates are rising, locking into a longer-term fixed rate mortgage will take out the risk of variable interest rate increases for a few years. However you do have to look a little deeper into what the interest rate increases actually imply.

Variable (floating) rates are based on the Prime Rate (currently at 2.70%), which is set based on Bank Of Canada (BOC) policy which is indicated through the "The Target For The Overnight Rate" (formerly called the Bank Rate, currently set at 0.50%). The overnight rate is the interest rate at which major financial institutions borrow and lend one-day funds among themselves.


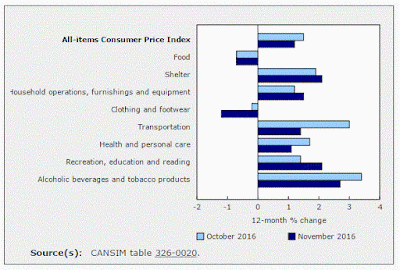
The setting of the overnight rate is a function of BOC monetary policy, which is mandated to provide a low, stable and predictable rate of inflation. Their inflation target is 2%. Currently the headline Total Consumer Price Index (last 12 months) is 1.2% (November's data). 


There are various measures that the BOC uses to extract more volatile data (like food and /or energy prices) from the total number and they range from 1.3% to 1.9%.

Needless to say, until inflation shows signs of moving higher, the BOC will likely not be raising interest rates and prime and variable mortgage rates should stay at the current low levels.

Longer term, fixed mortgages are based on bond yields and the bond yield curve. Since November and the Trump election, bond markets have pushed yields higher and the yield curve has steepened: longer dated maturity yields have risen faster than shorter term yields, putting upward pressure on fixed mortgage rates.


Bond markets at the 5 year maturity (horizontal axis) are higher by about 0.40% as higher inflation expectations are being built in to the current environment (which is taking anticipated US fiscal spending into account). Increased deficits, also in Canada, will require increased bond issuance, which will also push bond prices lower and yields higher.

As I said initially, there is no simple answer because it depends on your personal financial situation in conjunction with the macro economic outlook: your cash flows and income vs. expenses analysis (Wealth Forecast). Locking in a fixed rate may make sense, depending on your needs. However, the variable rates are likely, over time, going to remain lower (on average) than the longer term rates (steeper yield curve). If your cash flow permits, it may be more sensible to remain variable as those rates will probably rise, but on average, rising variable rates will not cost you more than locking in a longer term rate. Eventually as the economic cycle progresses and inflation is no longer an issue, variable rates will fall, but you do not want to be locked in when this happens.

Feedback...

If you would like to receive this blog directly to your inbox...

Tuesday, January 3, 2017

TSX 2016 Performance: Another Reason For A More Tactical Approach

The S&P / TSX was the best performing (developed economy) stock market in 2016 (that was the big headline). If you were 100% invested in the SP / TSX you could have achieved a total return (including dividends) of a little over 21% (according to our Bloomberg analytics):


However, the reality is that you would have had to have not been invested in the SP / TSX through 2015 because the 2 year (through to Dec. 31, 2016) total return was a negative 3.5%:


So you would have had to have tactically shifted into the SP / TSX at the beginning of the year in order to capitalize on the great returns of 2016.

Did your portfolio get re-balanced last January?

On my BNN appearance (and on our weekly client webinars) in December of 2015, I suggested an over-weight of exposure to Canadian equities because in 2015 it had been the worst performing stock market (of the developed economies) in 2015. That would / should have been a natural allocation adjustment as it would have likely dropped in a standard, 60% equity balanced portfolio.


The diversified MSCI All Country World Index (our global equity benchmark) has a weighting of a little over 3% for Canadian Equities:


If you have a globally balanced equity portfolio with a 60% equity allocation, you would have exposure to approximately 1.8% of your portfolio dedicated to Canadian equities. Any more than this and you would be over-weight.

Having exposure to our (High Rock) tactical model (depending on your asset allocation strategy) would have automatically given you the over-weight to Canadian equity (and high yield) markets that I suggested.

The High Rock Canadian High Yield Bond Fund (which we managed, but has been since closed (following advisor redemption's) had a total return of a little better than 23% in 2016 :


A full-year client for 2016 (we began our private client division in April of 2015 and we had many new clients joining throughout 2016)  would have seen better than benchmark returns because we had greater exposure to Canadian equities, non-correlated high yield bonds (which we tactically added in January and February of 2016), and non-bank, fixed rate re-set preferred shares (which we tactically added in November and which jumped in price in December as bond prices fell) .

The balanced benchmark for comparison purposes, 60% ACWI ETF ( + 8.4%) / 40% XBB (Canadian bond index) ETF (+ 1.29%) had a total return of 4.63% (allowing for fees and hidden MER costs of 1.15%) over 2016.

The 2 year balanced benchmark total return (after fees and costs) was a negative 1.36%. 
ACWI = -1.58%  
XBB = + 2.27%).

High Rock clients would have benefited from tactical adjustments to their portfolios, which can only happen for all clients simultaneously by virtue of discretionary portfolio management, where automatic re-balancing and asset allocation strategy adjustment can be done regularly, as required.

That is the benefit of true portfolio management.

We shall discuss this in greater detail on our weekly client webinar and shall post the recorded version on our website  (http://highrockcapital.ca/current-edition-of-the-weekly-webinar.html) at or about 5pm next week (January 10, due to some technical issues). Feel free to tune in.

Feedback...

If you would like to receive this blog directly to your inbox...


Wishing you all a Happy. Healthy and Prosperous 2017!

And remember... past performance is no guarantee of future performance, although at High Rock we use our experience, expertise and deep research to do all that we can to provide the best possible risk adjusted returns for ourselves and our clients.