Friday, May 29, 2015

5 Months Into The Year


Let's have a peek at what has been happening with the components of the 60/40 model:
(60% Equity / 40% Fixed Income)

Remember that the idea behind the 60/40 model is balance and diversification over long periods (multiple years). The different asset classes that are represented will have periods of out-performance and under performance over this time, but the mix is intended to drive down volatility and provide target annual average returns of between 7 and 8% over a multiple year time horizon.


(click on the chart to enlarge)
Returns are before fees and tax considerations and are based on a broad mix of ETF's with consistent weightings back tested over 11 years, re-balanced quarterly (inclusive of the period 2008-2009), however historical returns are not a guarantee of future returns.


Best performing assets (total return) this year to date (since Jan.1):
  • International Large Cap (Companies) = up close to 17% 
  • Emerging Markets (lead by China) = up close to 14.5%
  • International Small Cap = Up close to 14%

Other notable performances:

  • Positions held in US $ (converted back to C$) have added an additional 7%
  • Canadian Small Cap and US Mid Cap companies indexes are up over 5%

"Under" performers:

  • Canadian Preferred Shares = down by approx 5%
  • Canadian High Yield bonds = flat

In reference to the theme that different assets out-perform and under-perform at different times (and justification for sticking with this model over long periods): 

last year at this time, the best performers were:

  • Canadian Inflation Indexed Bonds
  • Canadian Large and Small Cap Companies
  • Canadian REIT's
  • Canadian Preferred Shares
Under-performers:
  • US Small Cap Companies
  • International Large Cap Companies


What is a highly important process in this type of model is the on-going re-balancing which trims (sells) the out-performing assets back to their original weighting and redistributes the cash by buying the under-performing assets which are underweight.

This is on-going profit-taking and using the proceeds to pick up under-valued assets.

For example if you trimmed Canadian Preferred Shares (last years out-performer) and picked up International Large Cap Companies (this years out-performer) you have added significant value.

The Takeaway:

 Balance, Diversification and Re-balancing are the keys to successful investing over a multiple year time horizon.


Thursday, May 28, 2015

European Confidence Slips In May


One of my themes for 2015 is that central bankers do not like volatility in financial markets because it creates uncertainty and in turn erodes confidence.

Confidence is important to to economic growth because consumers need to be confident about their future prospects in order to spend.

Businesses need to be confident in order to invest in growth.

Otherwise both will postpone their spending and investment decisions until they become more confident.

Central Bankers have been fighting volatility with stimulative ("easy") monetary policies  since 2008 in order to curb volatility and inspire confidence.

The European Central Bank (ECB) embarked on an aggressive bond buying strategy at the beginning of 2015 as a form of "Quantitative Easing" to jump-start a European economy that has been been stalled and suffering from deflationary pressures..


The impact of the the bond buying strategy drove short-term interest rates into negative territory and German bond yields to close to 0 in mid April.


However, at the end of April and into early May bond market volatility spiked as bond investors became more concerned about the future end of the Quantitative Easing and a jump in inflation.

This spike in volatility combined with the concerns over Greece has impacted European Confidence in May:

  • This morning, data showed that European Area Business Confidence fell in May after having been improving earlier this year:

  • Also this morning, data showed that European Area Consumer Confidence declined for the 3rd month in a row:
In light of the volatility in early May, the ECB , in an effort to bring it under control, announced that they were increasing their bond buying in May and June. This has decreased volatility, but it remains to be seen if this will impact future consumer and business confidence.

Stay tuned....

Wednesday, May 27, 2015

Higher Highs and Higher Lows:


The Up-Trend For The S&P 500 Is Still Intact.

  • Technically, long-term trend line support for the S&P 500 is at approx. 1970-80.
  • Although yesterday registered a significant drop on higher than average volume, until enough selling interest enters the market to push it through that level, the up-trend will continue.
  • Trading volume is a concern, as the up-days continue to reveal lower than average volume and the down-days have higher than average volume, however there has not been enough price movement or momentum in either direction to take the S&P 500 out of its short-term range:


  • Volatility jumped yesterday, but in general has been well below its historic averages and certainly significantly lower than it was earlier in the year:

What comes next?
  • We continue to believe that stocks are expensive:


  • However until a sustained break-out from the current trading range in (either direction) occurs, the short-term looks like it will be more of the same, range-bound trading.
  • If enough buying emerges to make new highs above 2135 and the market is able to sustain those, a move to 2150 will be likely.
  • If selling enters the market, there are a number of points where we would expect to see buying support:
  • 2090 at the short-term trend-line.
  • 2040 at the March lows.
  • 1970-1980 at the December lows and the long-term trend-line.
  • That would be approx. a 6% correction.
  • We are due for a correction, but only time will tell as to when.
  • We remain cautious.

Tuesday, May 26, 2015

A Few Thoughts on DIY (Do It Yourself) Investing


There is a reason why professionals are labelled as such:
They have taken the time to study, pass exams and practice their profession for many years.

I remember the first time I tried to install a new shower valve myself:

12 hours and 3 spools of solder later, I called the emergency plumber, who quite cynically quipped that he had attended school for 2 years to learn his trade.

As will always be the case, there are some who may take advantage of their superior education and training to over charge and under serve their respective clientele.

This prompts a number of folks to decide to try it on their own.

In the investment industry, the advance of ETF's (Exchange Traded Funds) in recent years has offered the DIYer's an opportunity to get low cost broad exposure to create balanced and diversified portfolios.

When the equity markets are rising in price (as they have been since 2009) it is easy to persuade yourself that you are good at this investing thing.

The S&P 500 (total return) is up approx. 21% annualized over that 6 year period. 

The SPY (low cost ETF ) is up just a little less that that.
The EFA (non-North America) ETF is up approximately 14% per year on average over the same period.
The broadly diverse World Equity Index ETF (ACWI) is up approx.  17.5% .

Not even the housing market in Toronto or Vancouver has given off this kind of return.

Of course you had to have bought in at the bottom in March, 2009 and held on through the stomach churning "is it 2008 all over again" period in 2011.

And then you had to resist the urge to take your profit along the way (and perhaps re-enter at higher levels).

Of course, all of the DIYer's that I talk to have done this and then some.

It's been a great run.

But what comes next?

What happens if volatility spikes (few have confessed to being "unnerved" by last October's steep drop) again?

How will you protect that handsome return?

Is it worth it to pay an additional 1% per year to get an expert to help you re-balance and to ensure you keep all that hard-earned return?

Your call.

Oh, and good luck with this....


Need help (not with the car engine or plumbing though)?
Let me know.

Monday, May 25, 2015

Inflation in North America:
Outside of Energy, It Is Gathering Strength


While the "headline" numbers look passively benign, when energy is factored out, both Canadian and US Consumer Price Index (CPI) data show inflation creeping higher.

Canada:
  • April CPI fell .1%, the "core rate" was unchanged from March.
  • Year over year (last 12 months), April CPI was +.8%, the "core rate" was +2.3%.
  • Gasoline prices were down 21% in April, 19.2% year over year.


  • All components except transportation rose.
  • Looking forward, when the impact of energy is reversed in 9 - 12 months time, the CPI headline number is going to shoot higher, with everything else being equal.
  • Canadian bondholders "real" returns (after inflation) will also move considerably lower.
  • It would not be surprising for longer-term bond investors to be demanding higher premiums over inflation (higher yields / lower prices).
  • Something to watch for as it will impact mortgage rates and other term borrowing costs.
  • The Bank Of Canada will have to be "on guard" if inflation rises without economic growth. 
  • In the 1980's we termed that scenario as "stagflation"!

US: 
  • A similar story: CPI in April rose .1%, but core (after food and energy) prices rose .3%.
  • The year over year core rate increased to 1.8% (closing in on the Fed's target of 2%).

  • Bond investors will be wary of their future "real" returns.
  • Attention must be paid.
  • We will be watching closely.

Friday, May 22, 2015

What's Happening Around The Globe:


China: Slowing Economy


 = expectations of lower interest rates =  record equity prices:

2015 = +44%


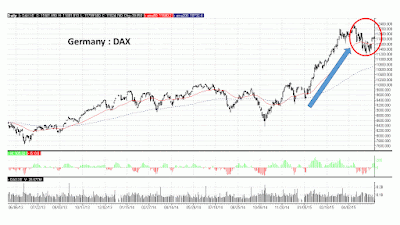
Germany: Business Confidence stalls:


Japan:


 Clearly it is not economic growth that is driving global equity markets, but it is lower interest rates or the expectation of lower interest rates as central banks continue to fight deflation and slow economic growth with stimulative monetary policies.

What happens when economic growth begins to improve?
or
What happens if economic growth does not improve?

How high is too high?


Thursday, May 21, 2015

Little New From The Fed's Minutes
But "Expect The Unexpected"


There was nothing significant in the Federal Open Market Committee (FOMC) minutes released yesterday other than a re-affirmation of expectations of better US economic growth in the coming quarters:

  • Most participants expected that, following the slowdown in the first quarter, real economic activity would resume expansion at a moderate pace.
  • While participants continued to see potential downside risks resulting from foreign economic and financial developments, most still viewed the risks to the outlook for economic growth and the labor market as nearly balanced.
  • Participants generally agreed that data on private spending for the first quarter had been disappointing, with unexpectedly weak household expenditures and investment spending. Retail sales had continued to be tepid, although consumer sentiment stayed high and auto sales rebounded in March.
  • Participants also pointed to other reasons for anticipating that the weakness seen in the first quarter would not endure. A number of the fundamental factors that drive consumer spending remained favorable, among them low interest rates, high consumer confidence, and rising household real income. 
  • A number of participants suggested that the damping effects of the earlier appreciation of the dollar on net exports or of the earlier decline in oil prices on firms’ investment spending might be larger and longer-lasting than previously anticipated.
  • In addition, the expected boost to household spending from lower energy prices had apparently so far not materialized, highlighting the possibility of less underlying momentum in consumer expenditures than participants had previously judged. Some participants expressed particular concern about this prospect, as their expectations of a moderate expansion of economic activity in the medium term, combined with further improvements in labor market conditions, rested largely on a scenario in which consumer spending grows robustly despite softness in other components of aggregate demand. 
(more here)


My Take:

  • There are some concerns about the consumer (who represents close to 70% of the US economy).
  •  Last week I posed a theory that suggested that demographic issues may be responsible for this change in the consumer.
  • Aging Baby Boomers are not spending (like they used to) as they save for (or enter) retirement.
  • Frugal Millenials (now the largest cohort in the population) have generally different lifestyle and consumption habits (than did their folks, the Baby Boomers).


  • It may be a combination of the winter slowdown and demographics or maybe it is as the Fed claims: just "transitory".
  • Nonetheless, attention must be paid!


Wednesday, May 20, 2015

Canadian economy rebuilding, though headwinds remain, says (BOC) Governor Poloz


Some key points from his speech yesterday to the Greater Charlottetown Area Chamber of Commerce:


"The Confederation Bridge has simplified the trip since it first opened. If you come to the Island by car, you don’t have to navigate the waters of the Northumberland Strait. According to the Canadian Encyclopedia, the shallow waters of the strait are susceptible to strong currents, tides and turbulence. Even the most skilled sailor can find it challenging to read the winds and waves, and to judge all the cross-currents.
If only the Canadian economy had a similar bridge. We’ve been on a voyage of rebuilding since the Great Recession. But the trip has been longer and more complicated than previous recoveries because of all the cross-currents acting on the economy. Not only are the headwinds of the global financial crisis still blowing, but now we’re also dealing with lower prices for oil and other key commodities, which previously were a key growth engine for us. The implications for income and investment, and the adjustments they’re causing across sectors and regions, may take years to work themselves out."
(more at the link below)


  • Canadian economy is once again on a course toward balanced sustainable growth.
  • However, there continue to be headwinds.
  • Led by non-energy exports (which are benefiting from a weaker C$) and stronger US demand.
  • There are signs of a recovery in the creation of new export companies.
  • Despite the uncertainties surrounding the oil price shock, the impact has occurred more quickly than expected, but has not been larger.
  • The underlying trend of inflation is somewhere 1.6 to 1.8%.
  • Expect the Canadian economy to reach full capacity by the end of 2016.


In a nutshell:

  • No surprise: The BOC continues to count on the future strength of the US economy to carry the Canadian Economy.
  • We will have to watch developments in the US to get a sense of what to expect for Canada.
  • We will also have to continue to watch the C$ performance vs the US$ (see last Fridays blog).
  • Oil prices are a "wild card".

Latest US Economic data:

Yesterday: Housing Starts showed some improvement after a difficult winter:


Tuesday, May 19, 2015

Bond Market Volatility: ECB Answers.


One of my Themes for 2015 has been that Central Bankers do not like volatility.

Volatility erodes confidence for those who participate in the economy: 

Consumers who are uncertain focus on savings and don't spend. Businesses postpone investing in growth activities until there is more certainty surrounding the future.

Recent Bond market activity, especially in the German bond market (but also in north American bond markets), has been quite volatile as bond investors  have become increasingly more concerned about building-in future inflation expectations in bond yields and prices.

In response, this morning the European Central Bank, through executive director Benoit Coeure, has announced that they will speed up their bond-buying operation (Quantitative Easing) in May and June. This has brought some buying back into bond markets as bond investor's fears of future inflation are brought back to more reasonable expectations.


In the UK, it was announced that inflation for April fell more than expected.

Meanwhile, last Friday's US economic data pointed to a less confident consumer and lower industrial production.

For the US Federal Reserve, a less confident consumer will be an important consideration when making the determination to begin to normalize interest rates in the US.


Friday, May 15, 2015

As Goes Oil, So Goes the C$


The US economy has begun the 2nd quarter of 2015 with a continuation of the anemic growth that characterized the 1st quarter: Industrial Production for April declined b y .3% and the Empire State manufacturing survey does not show much improvement for May.

As I stated yesterday, with consumers not consuming, producers have to scale back. The US Federal Reserve thinks that this is temporary (as it was last year), however the consumer has more purchasing power with both the higher $US and lower oil prices, but at the moment this is not filtering back into the economy. Is it temporary or is it a structural and demographic and therefore a longer term phenomenon. 

BOC Governor Poloz has stated that he expects the US economy to pull the Canadian economy along in the 2nd half of 2015, as he expects that a weaker C$ (vs US$) will assist non-energy exports (and the US is Canada's biggest trading partner).

Lately, however, the C$ has been moving higher (as the US$ has fallen) and this is playing against his theory at the moment.

Currency traders have been "pegging" the C$ to oil prices since mid 2014 and this correlation, while usually short-term in nature, has continued.

Recently, since hitting a low near $45 in mid-March, oil has bounced back to near $60.

The $C has followed from a low of  near .77 to its current level above .83.


The future direction of Oil prices is going to be watched closely by Governor Poloz as he tries to gage the impact of  both Oil prices and the C$ on his projections for the Canadian Economy and the corresponding monetary policy if his expectations do not play out.

If the C$ gets too strong, Canadian non-energy exports could become less competitive and this scenario could become a drag on economic growth.

If Gov. Poloz lowers the bank rate, that could in turn push the C$ lower and give the Canadian economy a needed shot of adrenalin. It could also help if the US economy continues to under-perform.

Stay tuned.

Thursday, May 14, 2015

Latest Economic Data:


As the last of Q1 data roll in showing Euro Zone economic growth accelerating (thanks to lower oil prices and aggressive Quantitative Easing by the European Central Bank), we are also getting glimpses of the early part of US Q2 economic growth (and remember one of my 2015 themes: all eyes are on the US economy which is expected to pull the global economy along in the 2nd half of 2015.

But also remember, one of my 2015 Themes is also to 
"Expect the Unexpected".

The US consumer is approx. 70% of the US economy. 

While the surveys tell us that the US consumer is more "confident", the US consumer is not spending:  

According to the latest retail sales data released yesterday: April Retail Sales were unchanged from March, less than the expected growth of .2%.


In its latest statement, the US Federal Open Market Committee (FOMC) stated that it felt that the latest Q1 slowdown was "transitory" (i.e. temporary). However, as we start to get a glimpse of the Q2 economy, it appears that, although employment continues to grow (US jobless claims fell to another 15 year low according to today's data) the consumer is reluctant.

If consumers aren't spending, inventories will start to build on the shelves and producers will have to cut back on production.

Further, in order to reduce inventories, sellers will have to cut prices. 

Reduced sales = reduced earnings.

Not good for share prices.

We shall have to watch the US consumer more closely going forward, however perhaps the changing demographic of the post - Great Recession era: aging "Baby Boomers" and frugal "Millenials" is creating a more "structural" shift in the US economy?

Something to think about.

...and this too!!


Wednesday, May 13, 2015

Fee Disclosure for Financial Advisors:


New fee disclosure rules are coming in July of 2016, but are they enough?

The changes are part of the second phase of the Client Relationship Model (CRM 2) that will require that investors get greater transparency in the fees that they pay for financial advice.

If a financial advisor receives a "trailer fee" from a mutual fund company, they will have to disclose the dollar amount that they have been paid on top of any fees that they receive from the client.

Obviously it will be incumbent on the advisor to communicate to the investor what services they are receiving for the fees that they are paying.

Certainly this is one step forward.

Read more here: 

However, what will not have to be revealed in this information are the fees that are charged by the mutual fund company, commonly known as the Management Expense Ratio (MER).

Every investor should be asking (and has the right to know)  what the actual costs are for the services they receive: retirement and estate planning, portfolio management, tax planning and insurance.

Understanding the costs of growing your assets is paramount, especially in a low return environment where those costs can eat significantly into your annual rates of return.

Ask the tough questions.

If you don't get the answers, think twice.


(click to enlarge)

Tuesday, May 12, 2015

Strategy And Risk: Part 2


In order to get rates of return at above-inflation levels , investors will need to take some "market risk" in their portfolios.

How much ?

Our research shows that a balanced portfolio, with a combination of fixed income (bonds and preferred shares) assets and global equity assets (large and small companies across all economic sectors) over a multi-year period can deliver rates of return well above the rates of inflation:


(click on this chart to enlarge)

  • Rates of return on the vertical axis.
  • Measure of risk / volatility (standard deviation) on the horizontal axis.
  • 11 year time period (through the very volatile period from 2008-2009).


  • A portfolio of 30% globally diverse equity assets and 70% fixed income assets, over 11 years has had an average annual return of approx. 6.77%. This is a portfolio that has a lower risk profile, because of it's heavier weighting of fixed income.
  • A portfolio of 40% globally diverse equity assets and 60% fixed income assets, over 11 years has had an average annual return of approx. 6.85%. This is a portfolio that has a higher risk profile, because of it's increased weighting of global equity.
  • A portfolio of 50% equity and 50% fixed income has returned approx. 7.16%.
  • A portfolio of 60% equity and 40% fixed income has returned approx. 7.51%.
  • A portfolio of 70% equity and 30% fixed income has returned 7.48%.

Why has the 70% equity (greater risk) portfolio under-performed the 60% equity portfolio?

Quite simply, the higher risk, more growth oriented portfolio underwent a greater degree of volatility during 2008-2009 and has taken a longer time to recover.

This makes the 60% equity portfolio a more "efficient" portfolio because it had less volatility through the 2008-2009 period and recovered more quickly.

Over different time periods returns can vary and historical returns do not guarantee future returns, however it is very evident that a balanced and diversified portfolio will help decrease long-term risk and allow reasonable and likely better than inflation returns.


Finding a strategic balance that reflects your plan is the next step.


That is the "secret sauce" in the management of your portfolio .


Monday, May 11, 2015

Once You Have A Plan, You Can Develop A Strategy:


Last week I suggested that if you really want to achieve your personal and family goals, that you had to have a plan.

At High Rock Capital Management, before we even begin to discuss your portfolio strategy, it is essential to understand what the expected results of that strategy are going to be.

So we prepare a "Wealth Forecast" to get a sense of the time frame (or time horizon) that will allow your goals to evolve and a sense of what growth rates are necessary to get you there.

Understanding the "pressure" that will be put on your assets to grow, allows us to understand what levels of "risk" will be necessary to accomplish the rates of growth that we need to achieve.

Furthermore, whether that level of risk is one that you are comfortable with.

What is risk?

Essentially, the inability to achieve your goals is the ultimate risk.

"Market Risk", on the other hand, relates to the ability of a certain set of investments to continue to grow (over time) and / or pay you for owning them.

Bonds for example, will pay you income at a certain rate of interest because you are loaning money to the bond issuer:

Therefore there are 2 important elements:

  1. The ability of the issuer to pay the set interest until maturity
  2. The ability to repay the principal upon maturity

When the "quality" of a bond is rated, it is based on those 2 key issues.

The higher the quality of the bond, the less risk of a default of expected payment.

However, higher quality bonds (such as those issued by the US Treasury or The Government of Canada), usually will pay less interest.

If you were not tolerant of any risk and only owned these high grade bonds, at the moment a basket of these bonds would give you an annualized return of approx. 2.6%.

Fully taxed as income, this would give you a net return (after tax, depending of your marginal tax rate) of approx. 1.6%.

If inflation is running at 2%, your aversion to risk will be costing you approx. .4% each year.

With this low (0) level of risk, your money will not be growing and if your goals are to achieve growth, your lack of "market risk" will actually, in itself, be increasing the risk of not reaching your goals.

So, basically, if you wish to get growth above the rate of inflation, you are going to have to take some "market risk".

How much ?

More tomorrow.